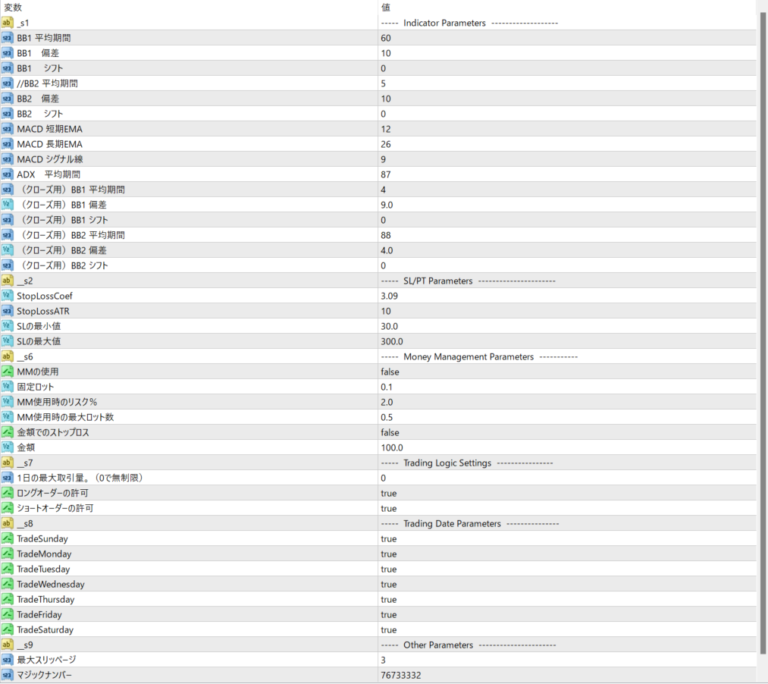


Heikin Ashi candles are used to calculate the open, close, high, and low prices, allowing for a more accurate understanding of past price trends. Bollinger Bands (BB) are used to determine whether the closing price is above or below the market level. The BBs are two lines drawn above and below a moving average, indicating how far the price has moved up or down. Approaching the upper limit of the BB indicates that the price has become too high, while approaching the lower limit indicates that the price has become too low. The Parabolic SAR is represented by dots that move downwards when the price is rising and upwards when the price is falling. This indicator is used to detect trends; when the price is above the SAR, it is considered an uptrend, and when it is below, it is considered a downtrend. The MACD is an indicator called the Moving Average Convergence/Divergence Index, which determines trends by comparing short-term and long-term moving averages. When the MACD line is above the signal line, it is considered an uptrend, and when it is below, it is considered a downtrend. The Relative Strength Index (RSI) measures the strength of rising and falling prices and is expressed on a scale of 0 to 100. When the long-term RSI is above 50, it is considered an uptrend, and when it is below 50, it is considered a downtrend. Short-term RSI is also used in the same way. The Stochastic Oscillator is an indicator that measures how far the price is from the closing price and is expressed on a range of 0 to 100. When the long-term Stochastic Oscillator is above 50, it is considered an uptrend, and when it is below 50, it is considered a downtrend. Short-term Stochastic Oscillators are also used in the same way. 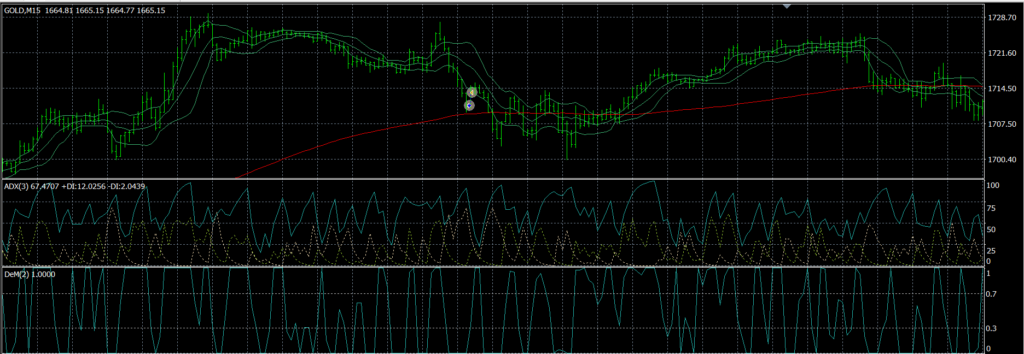 It only enters once per day. Furthermore, it closes on the same day. SQX_M30 was created as a recommended EA for creating portfolios. Entry signals are not generated as signals, but rather as a combination of multiple filters. We will explain the entry logic and parameters. Entry: When the lower limit of the Bollinger Bands crosses and exceeds the upper limit. Entry occurs when the MACD is higher than the ADX and the ADX_DIPLUS is below a certain value or crosses and exceeds the ADX_DIPLUS. A short trade occurs when these two conditions are met. In this EA, BB1 refers to the upper part of the Bollinger Bands, and BB2 refers to the lower part. The logic is built using the bandwidths of BB1 and BB2.
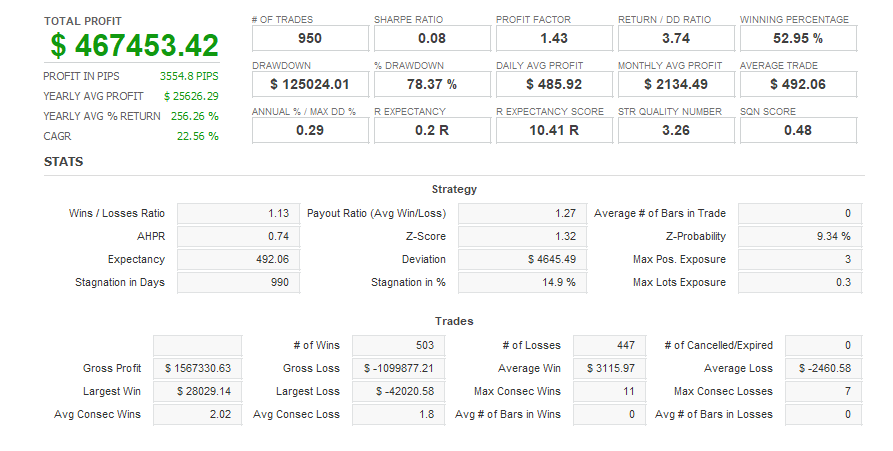
Total Profit
3,405